Insights from the Prometheus Compatibility Survey
Prometheus and OpenTelemetry are two of the most active and popular projects in the CNCF observability landscape. The two communities have been working together since the early days of OpenTelemetry to improve the compatibility between the two projects. The OpenTelemetry Prometheus SIG has been leading this effort, with the active participation of maintainers from both OpenTelemetry and Prometheus.
At this point, there is a detailed, experimental specification describing how to convert between the OpenTelemetry metrics data model and Prometheus metric formats. It has been used to implement Prometheus (pull) exporters for OpenTelemetry SDKs, OTLP export from Prometheus libraries, OTLP ingestion for the Prometheus server, and the OpenTelemetry Collector’s Prometheus Receiver, Prometheus Remote Write exporter, and Prometheus (pull) exporter.
One of the most challenging areas to reconcile is that OpenTelemetry metric
names are changed when exporting to Prometheus. Today, the OpenTelemetry
http.server.request.duration metric, with unit s, is translated to
http_server_request_duration_seconds in Prometheus. Some users are familiar
with the Prometheus naming conventions, and appreciate the consistency this
translation provides with existing metrics in the Prometheus ecosystem. Other
users are confused when querying for the original OpenTelemetry name does not
return any results.
Prometheus is working on support for UTF-8 characters in metric names as part of its 2024 roadmap, which potentially allows preserving dots in metric names. To better understand what users want their Prometheus query experience to look like, the OTel x Prometheus Working Group ran a survey with the help of the OpenTelemetry End User SIG. Deciding on the default translation approach is one of the last remaining blockers for stabilizing the compatibility specification.
The survey received 86 responses (and 5 spam), and contained many helpful pieces of feedback. Thank you to everyone that participated! The questions and raw results can be found here.
Overall takeaways
- A majority (60%) prefer leaving the dots in the metric name, rather than translating to underscores.
- A slight majority (54%) prefer having the unit in the name, but only 37% think it should be required.
- Respondents who prefer units in the metric name are likely to also prefer translating dots to underscores.
- The best predictors of the “units and underscores” group are Prometheus server experts and being an SRE.
- The best predictors of the “no units and dots” group are OpenTelemetry library experts and being a developer.
Who took the survey
Survey respondents were mostly from large (>1000 employees) companies (52%) in the Technology industry (71%). Respondents were more likely to consider themselves experts with Prometheus-related topics than with OpenTelemetry-related topics, and were evenly distributed across roles. Nearly all respondents (>90%) stored metrics in the Prometheus server or another open source Prometheus backend, and nearly all use PromQL to query their metrics.
Sentiment on the Current State
Overall, respondents were neutral on the question of whether OpenTelemetry was easy to use with Prometheus, and considered the current translation between OpenTelemetry and Prometheus somewhat confusing. This was consistent regardless of their opinions on units or delimiters.
Dots and Underscores
OpenTelemetry specifies that conventions
should use dots as the namespace delimiter, and underscores as the delimiter
between “multi-word-dot-delimited components” (for example,
http.response.status_code). On the other hand, Prometheus
uses underscores
as its delimiter.
Currently, when exporting in Prometheus format from an OpenTelemetry SDK, all dots are changed to underscores to comply with the Prometheus requirements. We wanted to learn whether OpenTelemetry users who used these exporters preferred to keep the dots in the original metric name, or liked the consistency with existing Prometheus metrics of translating to underscores.
Of users who indicated they used OpenTelemetry for metrics, and PromQL as their query language, 60% preferred keeping the original OpenTelemetry metric name including dots, and 40% want metric names that match Prometheus conventions with only underscores.
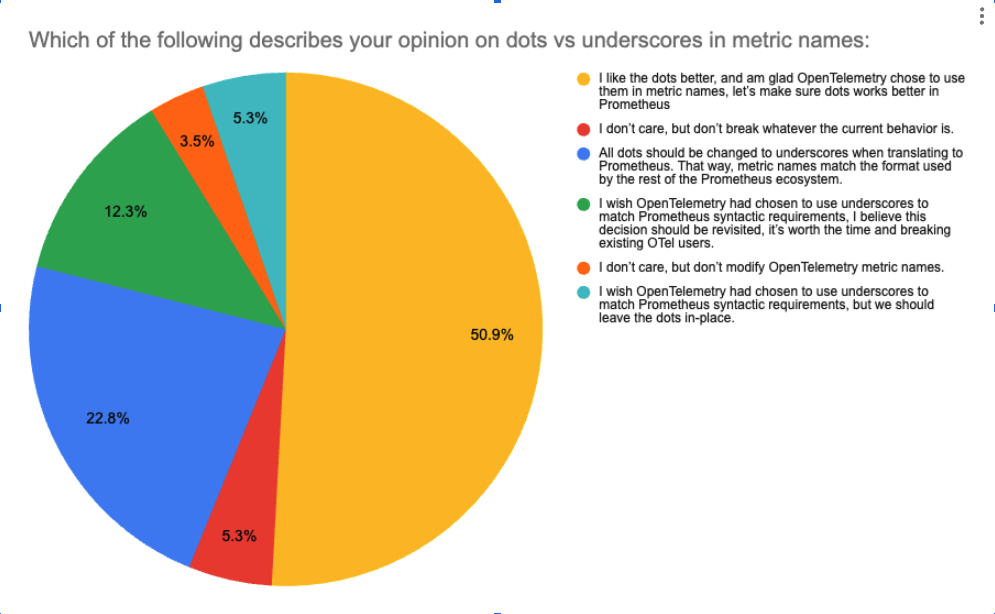
When we asked about specific example PromQL queries or alerts, the results roughly aligned with the results above. Around 42% of users only selected queries with dots, and around 39% only selected queries that had underscores. The final 19% selected a mix of queries that included dots or underscores, indicating they are likely OK with either approach.
Units in Metric Names
OpenTelemetry specifies that units should not generally be included in the metric name. Prometheus conventions recommend that the unit be included as a suffix of the metric name. OpenMetrics goes a step further and requires this unit suffix. Currently, when exporting in Prometheus format from an OpenTelemetry SDK, the unit is added as a suffix to the metric name.
Of users who indicated they used OpenTelemetry for metrics, and PromQL as their query language, 37% thought units should be a required suffix for metric names, and 46% thought units should not be added to metric names. The final 17% preferred the unit in the metric name, but didn’t think it should be required.
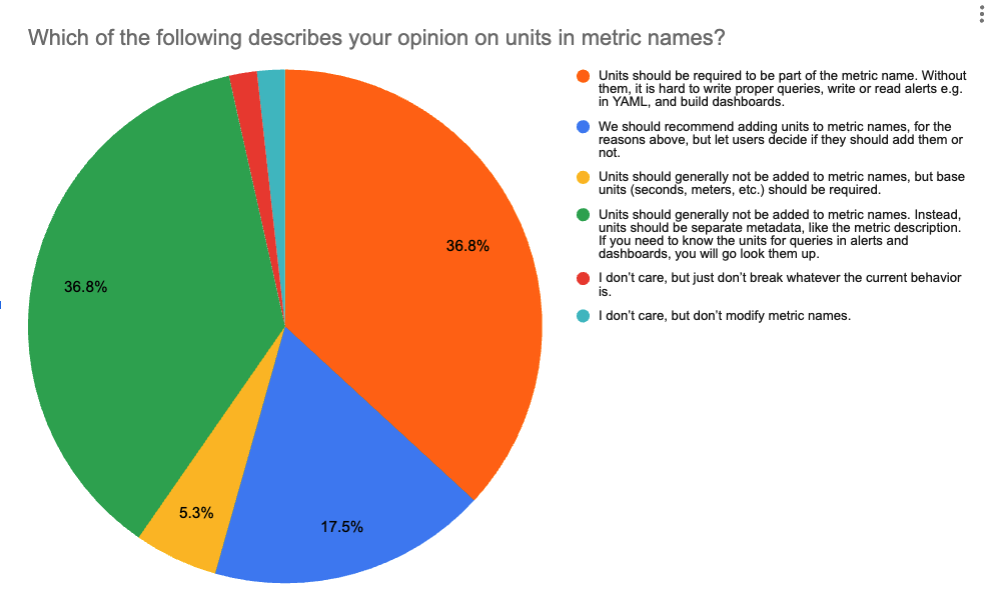
When we asked about specific example PromQL queries or alerts, the results were somewhat more favorable to including the unit in the metric name compared with the question above. Around 45% of users only selected queries that included the unit, and around 28% only selected queries that excluded the unit. The final 27% selected a mix of queries that included or excluded the unit, indicating they are likely OK with either approach.
Trends
Correlation between Unit and Delimiter Preferences
Preferences generally split into two groups: Those that want to preserve the original OpenTelemetry metric names, including dots, and without a unit suffix, and those that prefer changing the name to match Prometheus conventions. 57% of respondents who want to require units in metric names want to also want to change dots to underscores. 77% of respondents who don’t want units in metric names prefer dots in metric names.
Group Differences
The best predictors of a preference for units required in the name and changing dots to underscores were having a role of SRE, and being an expert with the Prometheus server configuration. For example, 88% of SRE respondents preferred translating dots to underscores.
The best predictors of a preference for preserving the OpenTelemetry name with dots, and without units were having the role of developer, and being an expert with OpenTelemetry libraries. For example, 88% of developers preferred not translating dots to underscores.
Other feedback
The most common challenge for all respondents was the instability of OpenTelemetry instrumentation, and confusion over the conversion logic. Respondents who preferred OpenTelemetry’s conventions listed Prometheus’ current lack of support for OpenTelemetry concepts (resource, scope, delta temporality, and unit metadata) as their most significant challenge. Respondents who preferred Prometheus’ conventions listed OpenTelemetry’s new concepts as confusing, and were unhappy that OpenTelemetry had deviated from Prometheus' existing conventions.
For the most part, this feedback aligns with the future plans in the OpenTelemetry and Prometheus communities. The OpenTelemetry semantic conventions SIG is working on stabilizing conventions for a wide variety of instrumentation. The OpenTelemetry Prometheus interoperability SIG is working on incorporating the results of this survey into the compatibility specification. The Prometheus community has ambitious plans to add support for OpenTelemetry concepts.
Keep in touch
Thanks again to everyone who participated in the survey! We rely on your feedback to help guide the future development of OpenTelemetry and to ensure it continues to meet your evolving needs. We will post upcoming surveys in the following avenues:
- #otel-sig-end-user Slack channel – you can also reach out to us here!
- End user resources page
You can provide further feedback or participate in discussions concerning OpenTelemetry and Prometheus interoperability in the #otel-prometheus-wg Slack channel.